Load timings on a schedule
Six timings are recorded on every run: Largest Contentful Paint, First Contentful Paint, Cumulative Layout Shift, Time to First Byte, Speed Index and Total Blocking Time.
Scheduled Lighthouse audits, run through the Google PageSpeed Insights API, track your Lighthouse scores and load timings over time so a slow deploy never reaches your users silently.
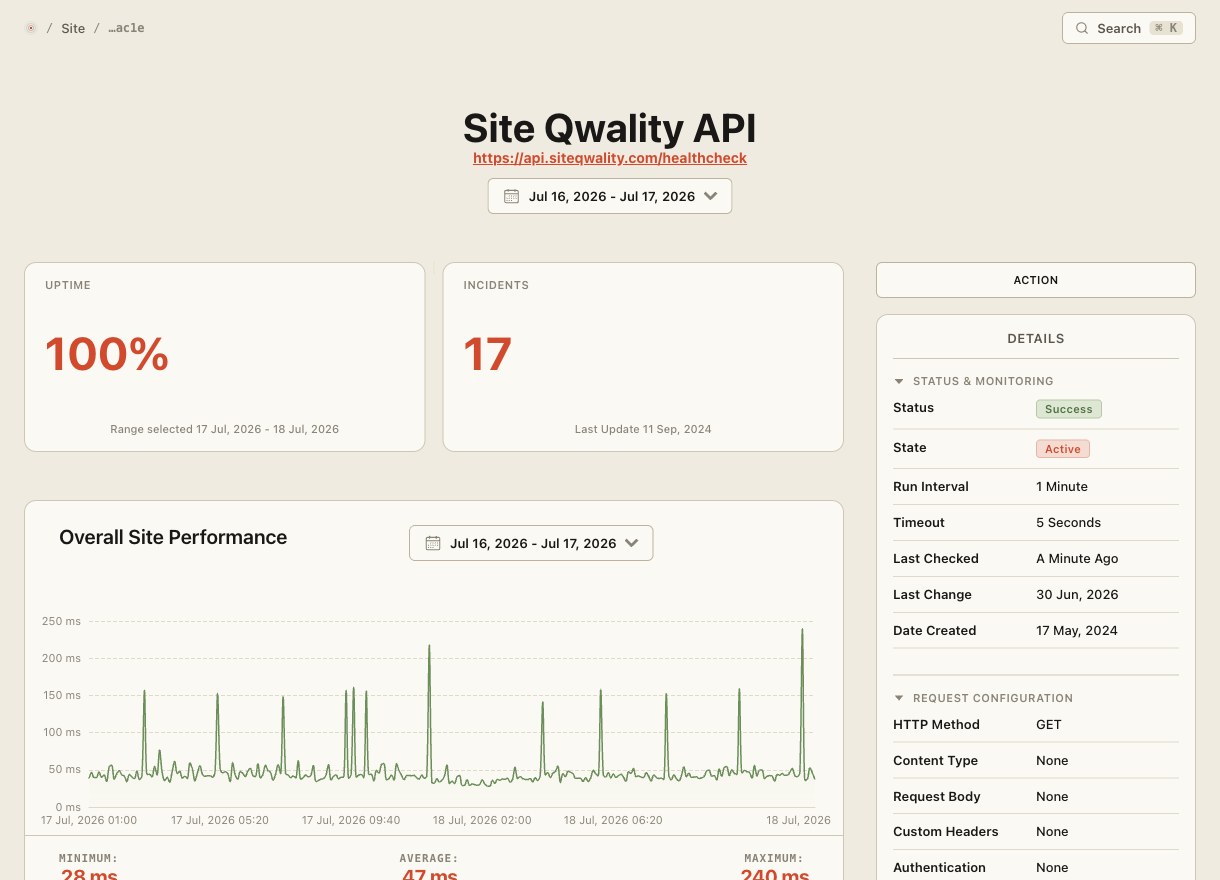
Every audit is a full Lighthouse run against your live URL, so it measures rendering, script execution and layout shift rather than just a ping to your server. We submit the URL to the Google PageSpeed Insights API and store what comes back, so the browser doing the rendering is Google's rather than ours. Every result is kept, so you can chart any score or timing across releases.
Audits run every 6 hours against the exact URL you give us, so you can point one at your checkout or your search results rather than only at your homepage. They do not follow the HTTP check interval.
Six timings are recorded on every run: Largest Contentful Paint, First Contentful Paint, Cumulative Layout Shift, Time to First Byte, Speed Index and Total Blocking Time.
Audits run against the desktop profile, which is the Google PageSpeed Insights default. We do not run a separate mobile audit today, and we would rather say so than let you assume a mobile regression would be caught.
Every score and raw timing is stored with the time it was taken, so you can chart movement over days, weeks, or between specific deployments.
Performance, Accessibility, SEO and Best Practices are each scored on every run, so a change that helps speed and hurts accessibility does not slip past.
The monitor fails when the Lighthouse performance score falls below 0.5, and an alert fires. That threshold is fixed today: there is no per-metric budget and no way to change the number, and this page will say so until there is.
Route score-drop alerts to Slack, Teams, email, or any webhook so the engineer who shipped the change hears about it immediately.
Speed tools that rely on HTTP-only measurements miss JS execution, render-blocking resources, and layout shifts that define real user experience. Every audit is a full Lighthouse run through the Google PageSpeed Insights API, so the rendering happens in a real browser, albeit Google’s rather than ours.
Page speed is not a separate monitor to set up. Turn it on for an existing HTTP monitor and the audit runs alongside the check, on the same schedule, and the alert reaches whoever is on call through the channels that monitor already uses.
scores and timings stored on every run
Lighthouse categories audited: performance, accessibility, SEO, best practices
free tier, no credit card needed to start
the one fixed threshold, on the Lighthouse performance score; below it the monitor fails
Site Qwality runs audits on a schedule, stores every result, trends them over time, and fires alerts when scores regress. A one-off Lighthouse run tells you where you are today. Scheduled audits tell you the moment something changes.
Ten values are stored on every run: the four Lighthouse category scores (Performance, Accessibility, SEO, Best Practices) and six timings (Largest Contentful Paint, First Contentful Paint, Cumulative Layout Shift, Time to First Byte, Speed Index and Total Blocking Time). To be explicit about what is not there, because these are commonly assumed: no Interaction to Next Paint, no Time to Interactive, no resource waterfall, no screenshots, no total page weight and no request count.
No. Audits run against the desktop profile, which is the default of the API we call. A mobile audit would be a second run with a different strategy and we do not make one today.
Not for page speed. The audit submits your URL to the Google PageSpeed Insights API, which fetches the page as an anonymous visitor, so a page behind a login cannot be audited this way. Our browser checks are the feature for signed-in journeys.
Not today. There is one threshold, on the Lighthouse performance score, and it is fixed at 0.5. Falling below it marks the monitor failed and fires an alert. Per-metric warn and fail budgets do not exist, and neither the dashboard nor the API can change the number.
On the schedule you set for the monitor the audit is attached to. Bear in mind that each run calls a Google API, so a very tight interval is rarely worth it for a page-speed audit the way it is for an uptime check.
Uptime, cron, synthetic, logs, RUM, incidents, and status pages. Free tier on every product.