Search with context
Combine message search with structured field filters. Use the time range and facets to focus on the service and events you need.
Bring your application logs into focus. Search the history, follow a live stream, and narrow the noise to the events that explain what happened.
Free tier included. No credit card required.
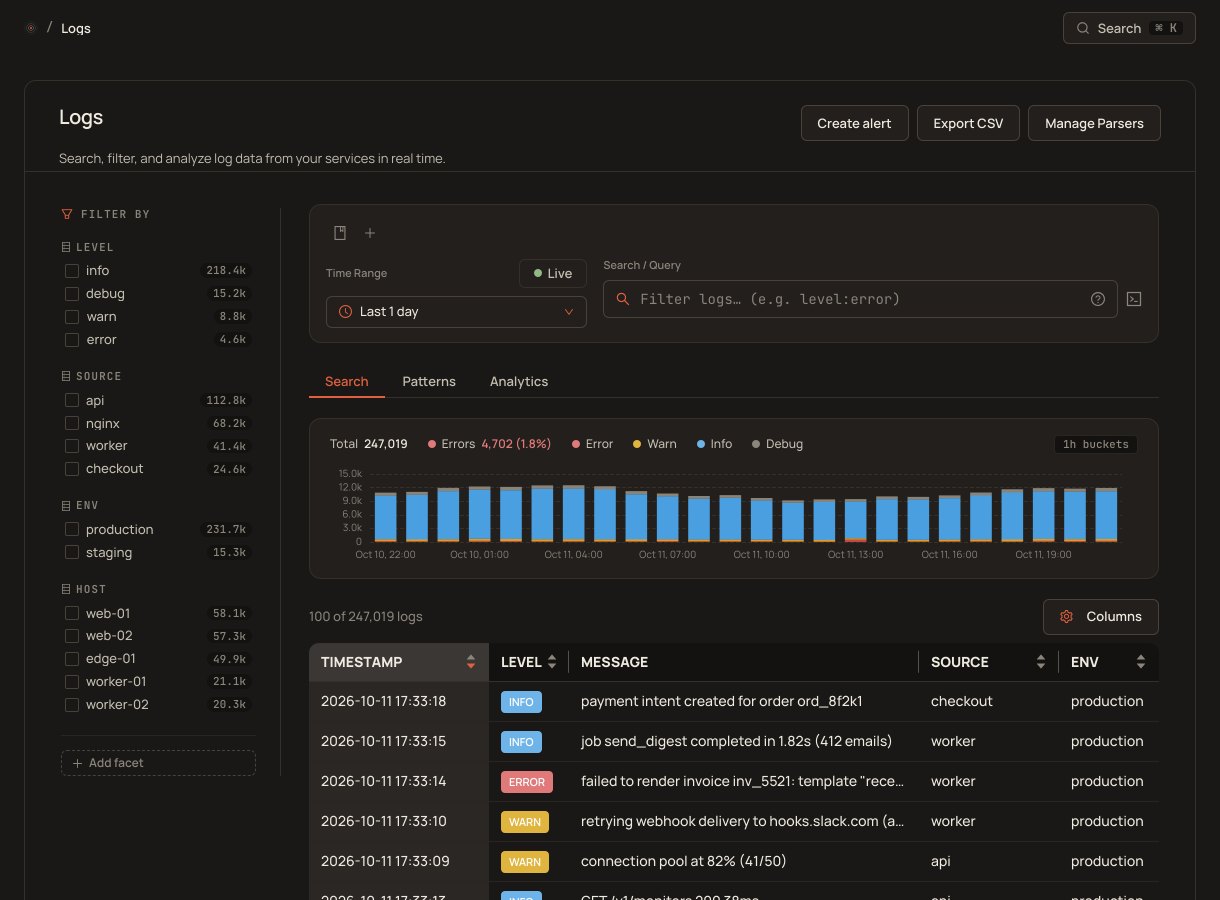
Start with a question, narrow it with fields, and follow the matching events. Your logs become a place to investigate, not just a place to store data.
Combine message search with structured field filters. Use the time range and facets to focus on the service and events you need.
Group search results into message patterns to understand what dominates an error spike without reading every repeated line.
Count matching lines over a rolling window and notify your groups when the count crosses a threshold.
Keep the time range, service and surrounding events in view.
Send structured JSON or raw text to an HTTPS ingest endpoint, straight from your code or from a forwarder that maps its records to our fields.
One place to investigate across the services that produced the events.
Narrow by time, level and source, then inspect the matching messages. Structured field filters help you focus before reading the full text.
Full-text search and structured filters can be used together.
Use live tail during an investigation or deploy. Turn a useful search into a count alert when you need to know if the same issue returns.
Log alerts notify groups. They do not create status-page incidents or enter on-call escalation.
The free tier includes 3 days. Paid telemetry bundles offer 15 or 30 days. Retention applies to the account and covers logs, metrics and traces.
Yes. Send JSON or plain-text log lines over HTTPS using your ingest credentials. A forwarder such as Vector or Fluent Bit can post to the same endpoint once its records use our field names, such as message, level and source.
Yes. Alerts count matching lines over a rolling time window and notify your notification groups. They use search filters, not the identity of a clustered message pattern.