Core Web Vitals on every page
LCP, INP, CLS, FCP, and TTFB collected from every page view — no sampling and no extra configuration required.
A ~4 kb script captures Core Web Vitals, JavaScript errors, page views, and session telemetry across 100% of real sessions — no sampling, no blind spots.
RUM captures what synthetic tests can't — the actual performance, errors, and behaviour your visitors experience across every device, network, and geography. Two modes let you go from aggregate trends to individual session detail in one click.
LCP, INP, CLS, FCP, and TTFB collected from every page view — no sampling and no extra configuration required.
Every visitor session is instrumented by default, so low-traffic pages and edge-case flows are never invisible to you.
Uncaught exceptions and unhandled promise rejections are captured in-session and linked to the user journey that surfaced them.
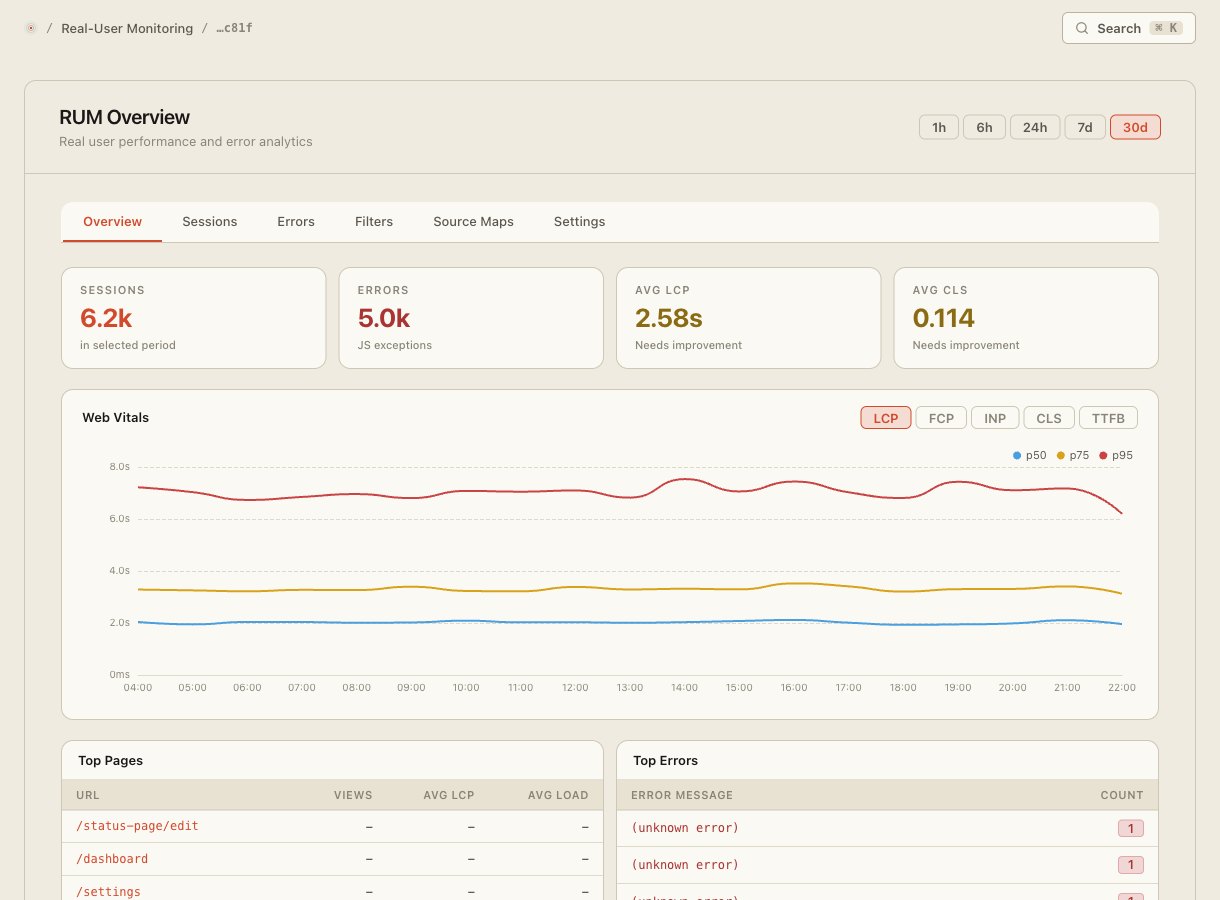
Trend Web Vitals by page, geography, device class, or browser across any date range with pre-built and custom dashboards.
Drill into individual sessions: full timeline of page views, performance marks, and linked session replay in one panel.
Filter and compare by country, device, browser, OS, URL pattern, or custom attributes you attach at script initialisation.
RUM Observe gives you the big picture: Core Web Vitals per page, p75 & p95 breakdowns, error rates, and session counts trended over time. Filter by geography, device class, or browser to pinpoint who is actually affected — before opening a single session.
Drop a single async script tag into your <head>. No build step, no webpack plugin, no server changes. The script is ~4 kb gzipped, loads non-blocking, and begins reporting on the next page view — works with React, Next.js, Vue, or plain HTML.
gzipped script size — no performance penalty
of sessions captured — zero sampling
Core Web Vitals tracked per page view
free tier — start without a credit card
The script is approximately 4 kb gzipped and loads asynchronously, so it does not block rendering or affect your own Core Web Vitals scores.
No. Site Qwality captures 100% of sessions by default. You will never miss a rare error or a low-traffic page because it wasn't in the sample.
RUM Observe shows aggregate dashboards — vitals trends, error rates, and segment comparisons. RUM Analyze lets you open individual sessions and inspect the full per-user timeline, including linked session replays and full error stack traces.
Yes. Call SQ.identify({ plan: 'pro', userId: 'u_123' }) at runtime to enrich sessions with any custom dimensions. You can then filter and segment by those attributes in both RUM Observe and RUM Analyze.
LCP (Largest Contentful Paint), INP (Interaction to Next Paint), CLS (Cumulative Layout Shift), FCP (First Contentful Paint), and TTFB (Time to First Byte) — all measured in real user browsers via the PerformanceObserver API.
Uptime, cron, synthetic, logs, RUM, incidents, and status pages. Free tier on every product.