LCP, INP and CLS at p75
The three ranking-signal metrics tracked at the 75th percentile — the threshold Google uses to assess whether a URL is "good."
Field data, not lab simulations. Track the three Core Web Vitals Google uses as a ranking signal — per page, per device, at the p75 — sourced from your actual visitors via the lightweight Site Qwality RUM script.
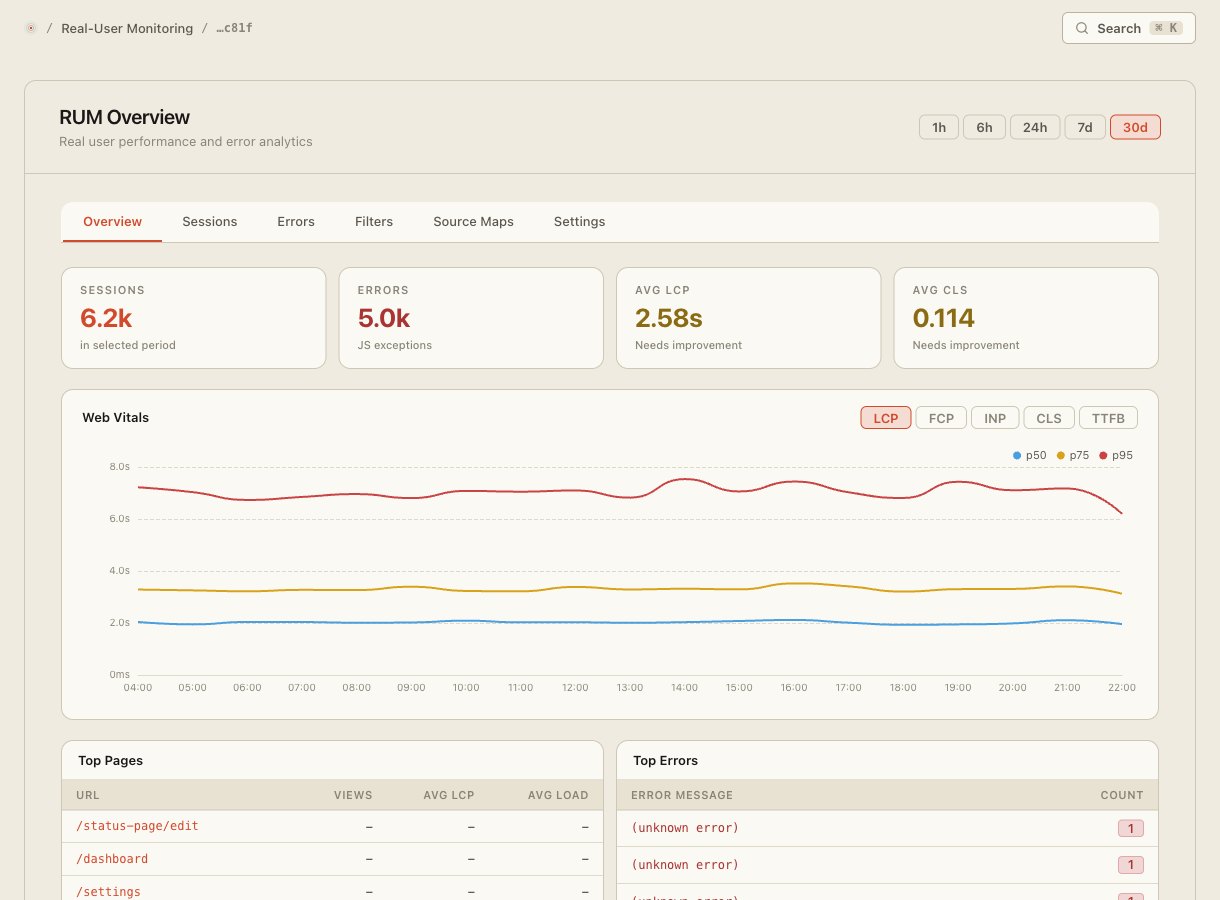
Lighthouse measures a lab condition. Core Web Vitals from real users measures what Google's crawler sees when it evaluates your pages for ranking. Site Qwality collects field data from every visitor and surfaces the p75 values per page, per device, and per release — so you can act on the numbers that matter.
The three ranking-signal metrics tracked at the 75th percentile — the threshold Google uses to assess whether a URL is "good."
Collected via the Site Qwality RUM snippet from genuine page loads — not a headless browser on a lab network.
See how LCP on mobile compares to desktop, and which specific pages have regressions rather than just a site-wide average.
Vitals are stored historically so you can chart how any metric moved across your last 30 deployments or the past 90 days.
Set a p75 threshold for each vital; an alert fires the moment field data shows users are experiencing above-threshold values.
Pair real-user vitals with scheduled Lighthouse audits to see both lab scores and field data side-by-side for every page.
A Lighthouse audit runs in controlled conditions: fast connection, powerful machine, empty cache. Your real visitors arrive on a 4G phone from across the world with 20 browser tabs open. Core Web Vitals field data captures their experience — and that is the experience Google ranks.
Mark deployments on your Core Web Vitals timeline and instantly see whether a release improved or degraded real-user experience. Combine with error tracking and session replay to understand not just that LCP got worse — but why.
Google ranking-signal vitals tracked at p75
gzipped RUM script — zero noticeable impact on LCP
the exact percentile Google uses in its Page Experience signal
free tier — start without a credit card
Lab data (from Lighthouse or synthetic audits) is measured in a controlled environment on a simulated device and connection. Field data is collected from real users on their actual devices and connections. Google's Page Experience ranking signal uses field data, not lab data, which is why tracking real-user vitals matters for SEO.
Google's Core Web Vitals assessment determines a URL's status — "Good," "Needs Improvement," or "Poor" — based on the 75th percentile. If your p75 LCP is under 2.5 seconds, 75% of your users see a "Good" load. Tracking p75 aligns your monitoring to what actually affects your ranking.
Add a single